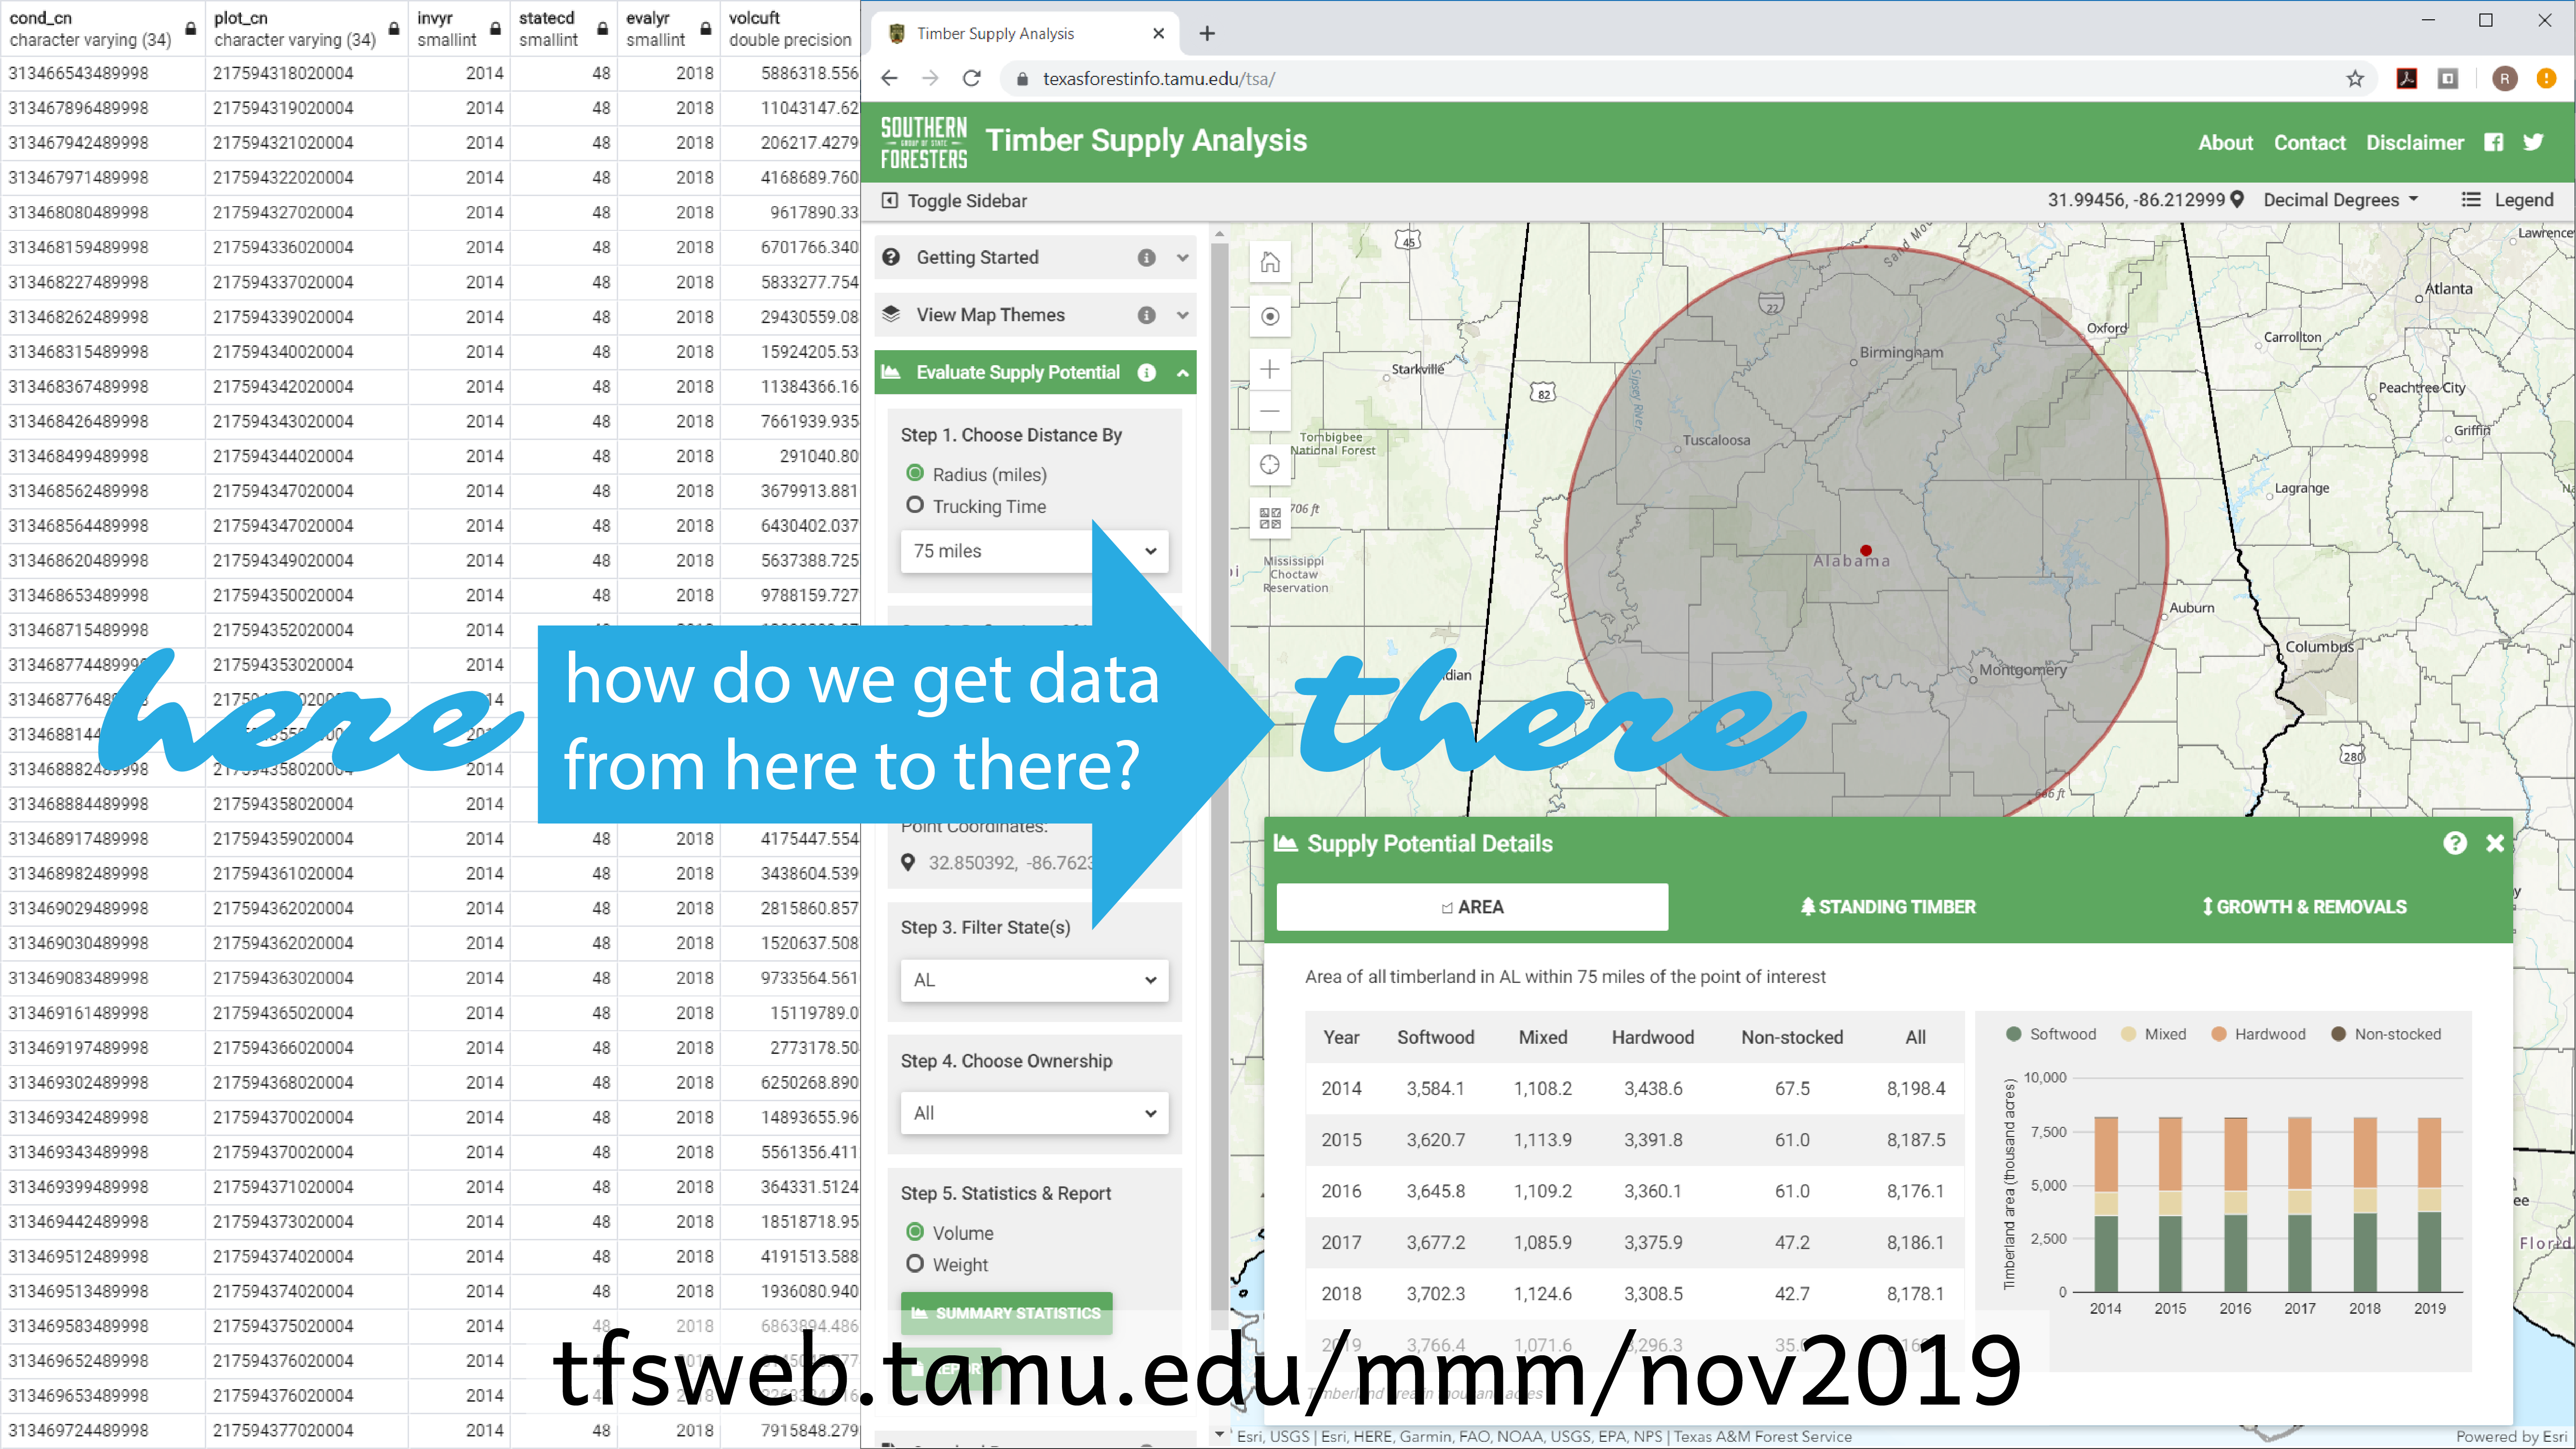
Southern Timber Supply Analysis: Data Wrangling
Southern Timber Supply Analysis is a web application that uses Forest Inventory & Analysis data to evaluate the supply potential of a user-specified area within
the southern United States. This month we’ll take a look at the data that underlies the app and how it is prepared.
FIA data is available to the public via the FIA Datamart. The first step of the process is downloading the data. I download the csv files for the 13 southern states
and then load them into a PostgreSQL database using scripts provided in the Datamart. Then the fun begins. The main point of the timber supply app is to improve efficiency for a user to
get commonly desired information. Basically, we’re compiling a bunch of FIA data to make retrievals fast and easy. FIA data is plot-based — each plot represents about 6,000 acres. The approximate plot locations are included in FIADB, and we use those
to sum up the estimates generated for each plot across the supply area.
I generate estimates of timberland area (broken out by major forest type groups); all live, pulpwood, and sawtimber volume and weight (each broken out by softwood and hardwood, and pulpwood and sawtimber broken out by additional categories); and all live,
pulpwood, and sawtimber growth and removals (broken out by softwood and hardwood). The area and volume estimates are given for the six most recent years. All these estimates are computed for all 13 southern states’ most recent data. Data availability
varies by state (for example, 2019 data is available for Alabama but 2016 data is the most recent available for Tennessee), so to support multi-state analyses, I also generate estimates for all the years between the oldest and newest data so that
there is common data between all the states.
I wrote a script with SQL to query all this data from FIADB and compile it. The script produces two csv files — one with a list of the states and their most recent year of data, and the other with all the data itself. These two files are then imported
to the SQL Server database that connects to the app. We’ll get into how the app interacts with the data another time.
We recently updated the data in the app. You can always see when I downloaded the data on the stat help page or at the end of a report. Here’s the latest data
currently available by state:
| | Alabama | 2019 |
| | Arkansas | 2018 |
| | Florida | 2016 |
| | Georgia | 2017 |
| | Kentucky | 2016 |
| | Louisiana | 2016 |
| | Mississippi | 2018 |
| | North Carolina | 2018 |
| | Oklahoma (East) | 2016 |
| | South Carolina | 2018 |
| | Tennessee | 2016 |
| | Texas (East) | 2018 |
| | Virginia | 2017 |
Join the conversation!
+ Contact
Rebekah ZehnderGeospatial Analyst
200 Technology Way, Suite 1281
College Station, TX 77845
979-458-6630 office
979-458-6633 fax
rzehnder@tfs.tamu.edu